


Indicators
Technical and Economic Indicators helps the forex traders to identify the Trading style which helps them to get a quick view about the FX markets before they start trading. Technical and Economic Indicators helps the forex traders to identify the Trading style which helps them to get a quick view about the FX markets before they start trading.
About Indicators
RSI
The RSI indicator is a momentum oscillator developed by Welles Wilder for the purpose of measuring the internal strength of security. It captures the change of price movements and the speed of the price. The name of the indicator may seem a bit misleading as it doesn’t really compare the relative strength between two instruments. RSI oscillates in a range of 0 to 100 and Wilder considered the area above 70 as overbought and the area below 30 as oversold. Later, the most famous practitioner of RSI Andrew Cardwell popularized the bull market and bear market ranges.
Read More
Stochastic
It was published in the 1950s by Dr. George Lane and is still in wide use to this day. It is helpful to generate overbought and oversold trading calls, a 0-100 bounded range of values. Stochastic oscillators are sensitive to momentum rather than absolute price. The trading signal used when there is a divergence-convergence in the indicator.
Read More
Bollinger Band
A Bollinger Band is a technical tool to display a graphical band defined by a set of lines plotted two standard deviations (positive and negative) on both sides of a simple moving average (SMA) of the security's price, but can be adjusted as an analyst preference.
Read More
MACD
Moving average convergence/divergence is an indicator used in technical analysis of instrumen prices. It was created by Gerald Appel in late 1970. The MACD indicator is a momentum oscillator widely used to trade in the direction of trends. It is established to reveal changes in the strength, direction, momentum, and duration of a trend in an instrument price.
Read More

Fibonacci
The Fibonacci sequence, introduced by an Italian mathematician Leonardo Fibonacci, gave birth to many mathematical tools used by the traders in the financial markets. The sequence looks like this – 1,1,2,3,5,8,13,21,34… Fibonacci Retracement levels are primarily ratios derived from this sequence which are used to ascertain important resistances and supports. The most important ratios are 0.618 and 1.618, followed by 0.50 and 0.382. The length of any up move (or decline) is divided into these ratios and checked if those are providing significant support (or resistance) in any of the corrections. There are more tools like Fibonacci Arc or Fibonacci Fan but those are not that popular.
Read More
Gann Numbers
Gann number was formed by the analyst W. D. Gann in the early 1900s. He is known as the biggest forex trader in history who traded even during the great depression period and made a huge profit of 92.9% accuracy with 265 winnings and only 22 losing trades out of 287 trades in total. The most specific feature about the Gann number is that it can predict the relative price movement of future price. Many traders around the world use this chart for depicting future contract movement.
Read More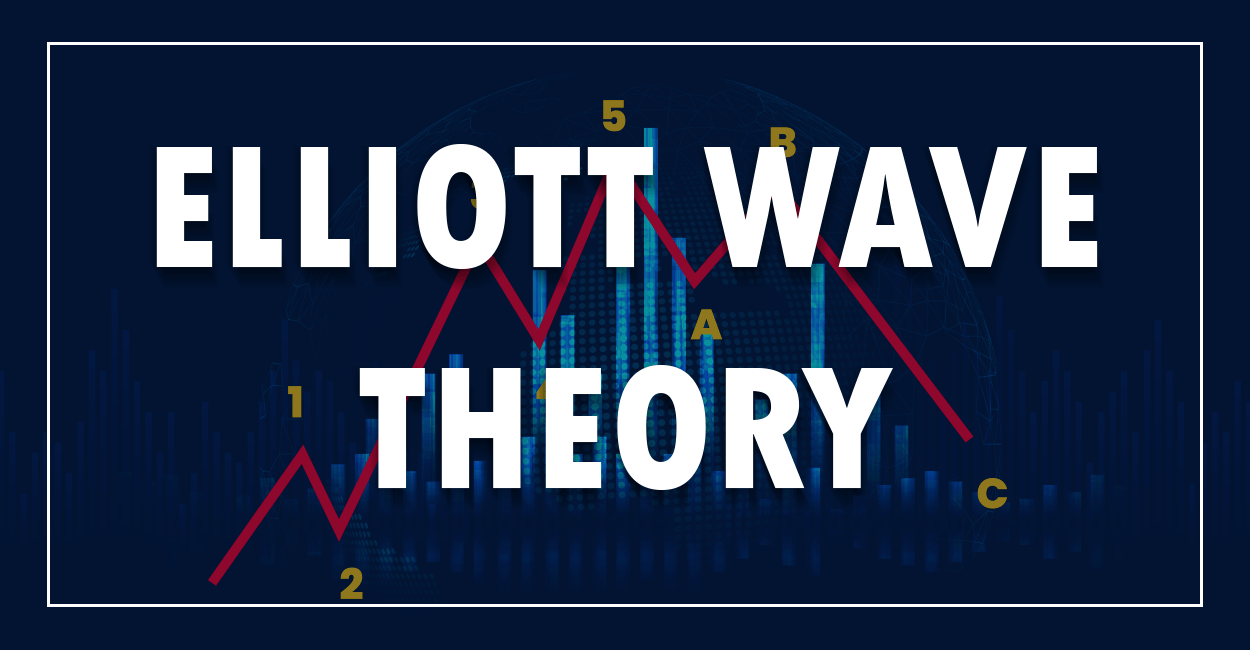
Elliot Wave Theory
Elliott Wave Theory, developed by R. N. Elliott, asserts that the crowd behaviour moves in distinct cycles of mainly greed and fear, which consists of an inherent order of a basic 5 wave impulse sequence and 3 wave corrective sequences. These two sequences sit at the very heart of the theory though much more advanced and complex applications are required before an application of the theory can be even thought about. The basic theory states that a 5 wave impulsive move may be followed by a 3 wave corrective move before the next set of 5 wave up move resumes the larger trend.
Read More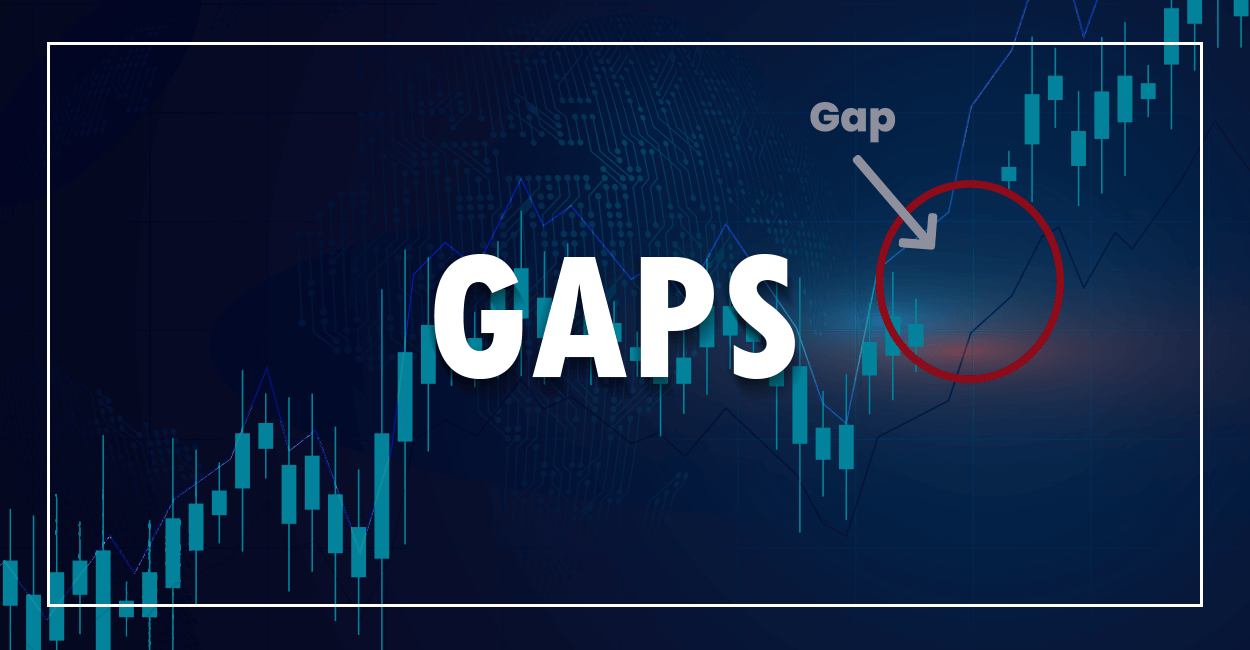
Gaps
As the name itself implies, the Gap is a blank space between two candles on a chart. It is essentially a change in price between the close of a session and the open of the next session. Depending on the context, the Gaps are divided into 4 categories and the trading ideas change accordingly. The first category is the Common Gap or Area Gap. It is found nearly all the time, especially inside a trading range, providing no clue with random price action following the gap. Area Gap is filled soon. The second one is Breakaway Gap, which generally marks out a breakout from an established trading range with the volume rising markedly.
Read More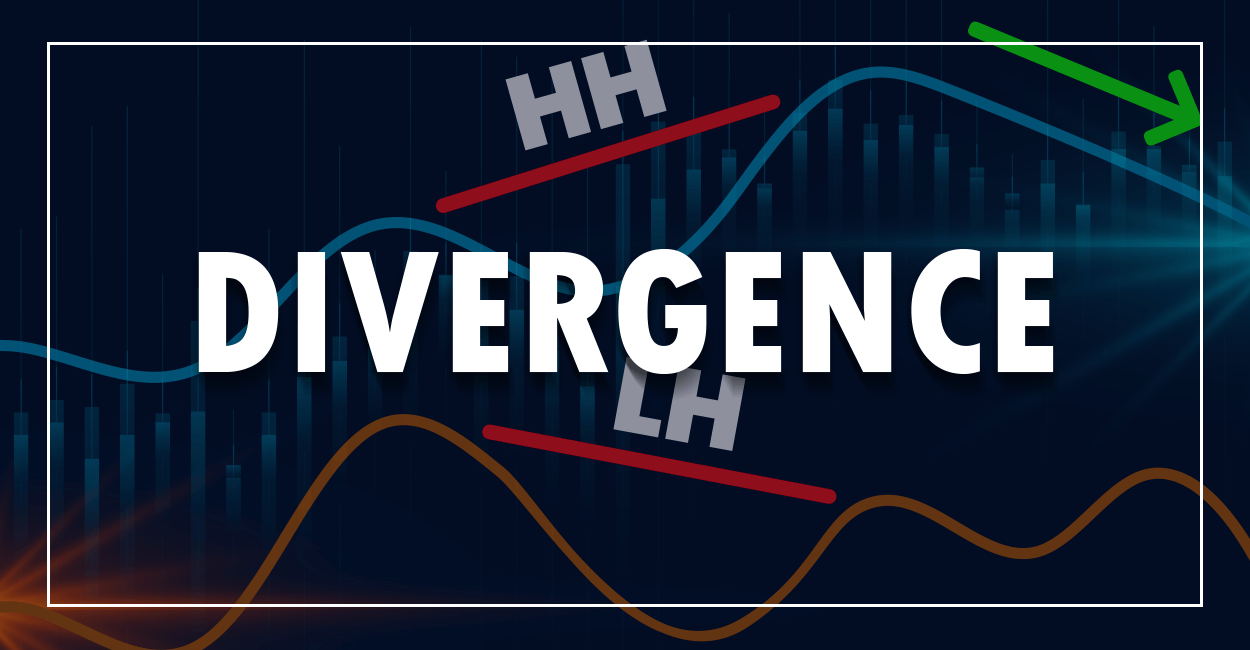
Bullish and Bearish Divergence
A Divergence is a lack of symmetry between the price and the indicator used. Generally a momentum indicator is expected to follow the price direction but if the indicator gets out of sync with the price, it is taken as a shift in momentum. If in a downtrend, the price hits a new low keeping the trend intact but the indicator fails to hit a new low, it is called a Bullish or Positive Divergence as the internal momentum is slowing down at that point. The reverse, if seen in an uptrend, is called a Bearish or Negative Divergence.
Read More
William % R
Williams %R, also known as the Williams Percent Range, is a type of momentum indicator that moves between 0 and -100 and measures overbought and oversold levels. It was developed by Larry Williams and it compares a stock’s closing price to the high-low range over a specific period, typically 14 days or periods.
Read More
Linear Regression
Linear Regression is a statistical tool used to get an idea about the fair value of an instrument. It is basically a straight line drawn in such a way that the space between the line and the price points stand at a minimum and the line is the best fit. The line shows the trend in a very simple way and whenever the price stretches away too much from the line, the traders expect a mean reversion to take place soon. To define the overstretching in a more objective manner, the furthest distance of a price high or price low is taken and two lines, both parallel to the Linear Regression Line, are drawn. It is called the Raff Regression Channel.
Read More