


Patterns
The forex and capital Markets trader use various types of pattern that help them to detect future price movements. This pattern may be bullish, bearish or unaligned. The forex and capital Markets trader use various types of pattern that help them to detect future price movements. This pattern may be bullish, bearish or unaligned.
About Patterns
Engulfing
Engulfing is a two candle pattern that is frequently seen on the charts. For the bullish case, the first candle must be a black one which is followed by a white candle that ‘engulfs’ the previous candle. In other words, the body of the white candle must be larger than the black candle. For the bearish case, the first candle would be white and the second candle would be black.
Read More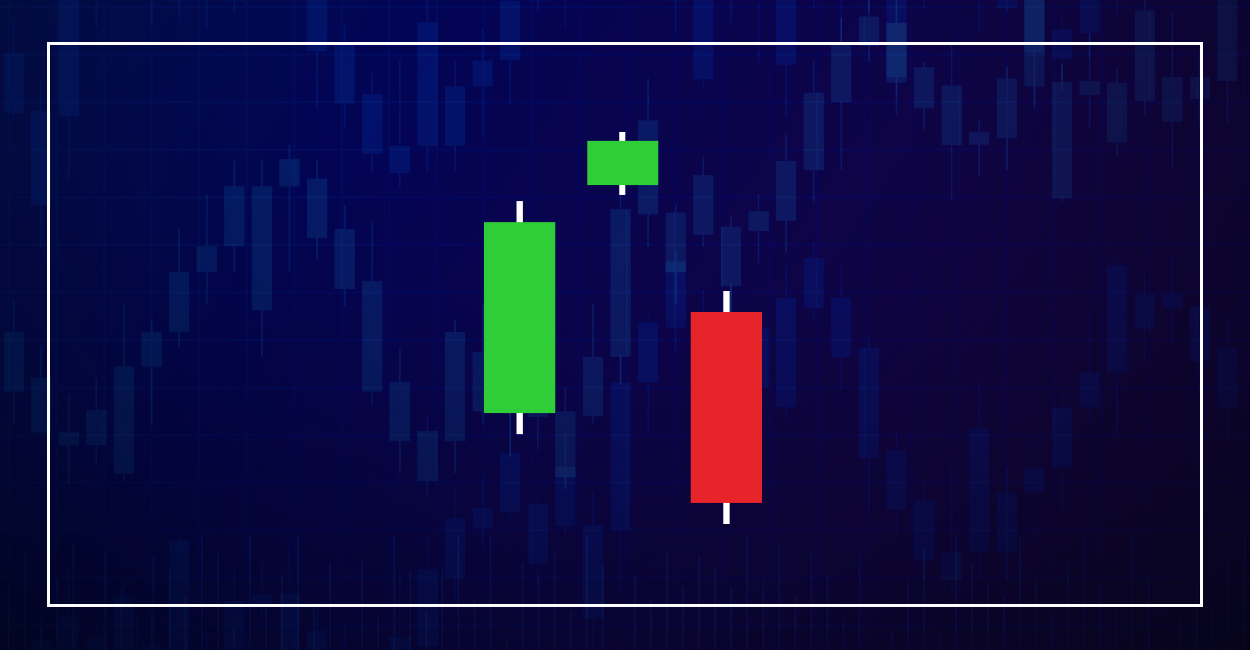
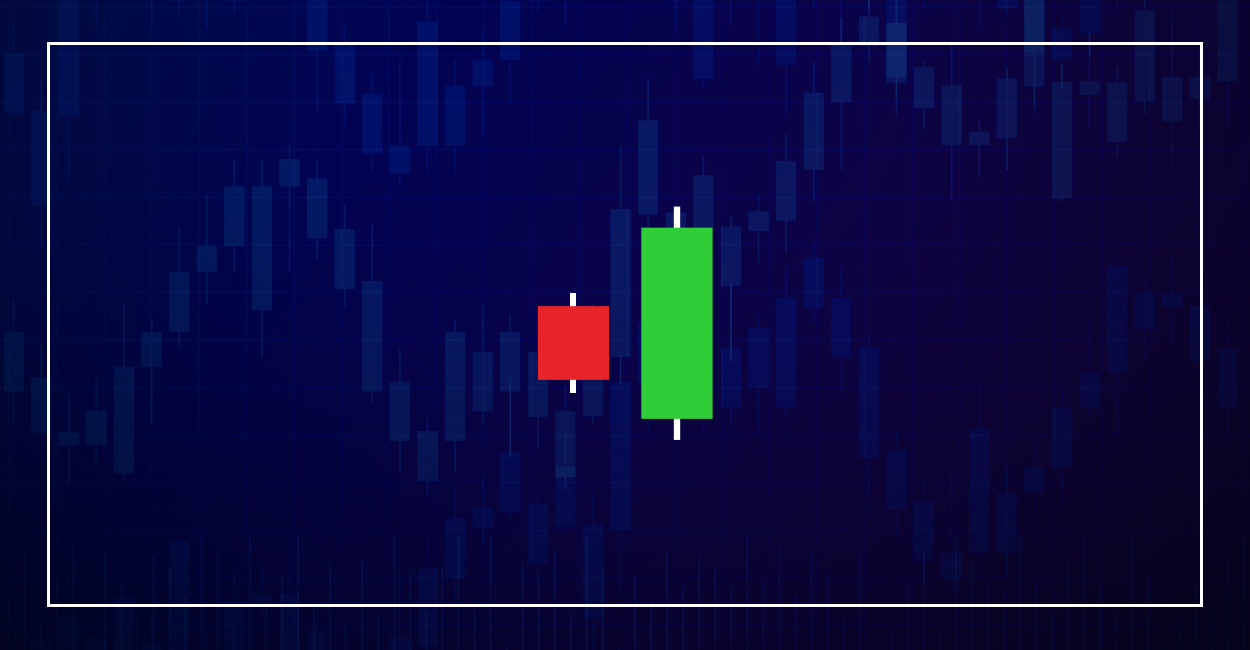
Star
“Star” is a three candle pattern that acts primarily as a reversal pattern. Generally, the first candle is a long one in favour of the prevailing trend and the second candle is a candle with a small body (color neutral) closing above the range of the first candle. The last candle is another large one with the counter-trend color, opening in the middle of or below the second candle and closing around the centre or low of the first candle.
Read More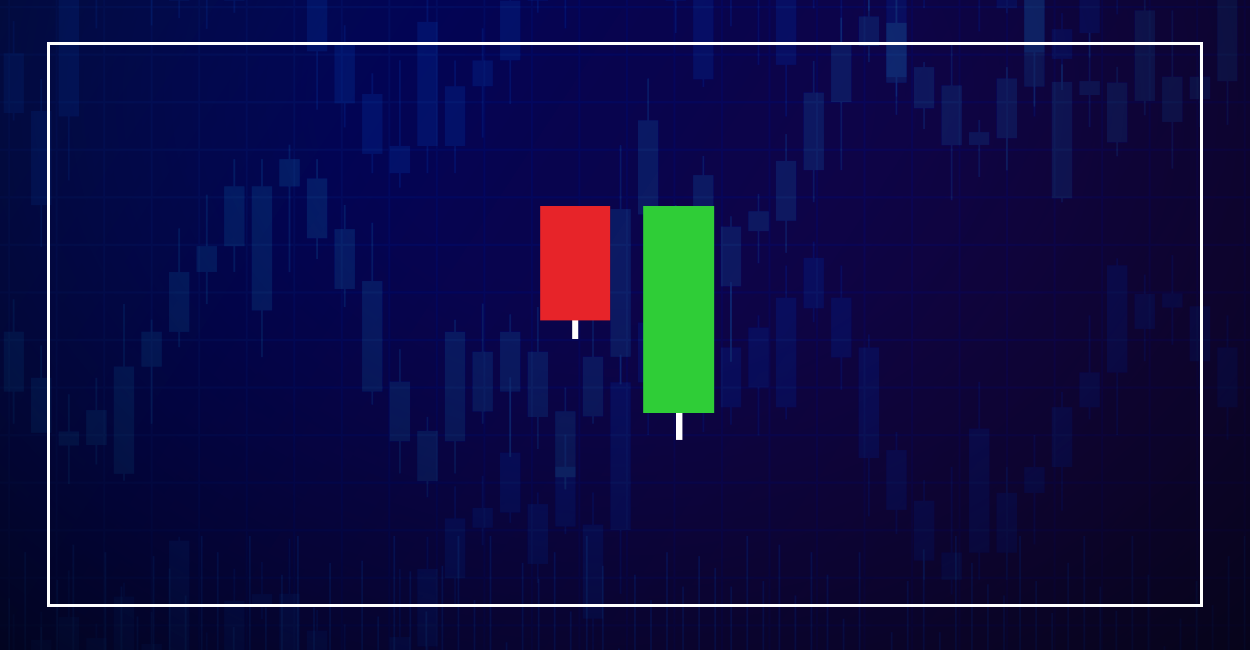
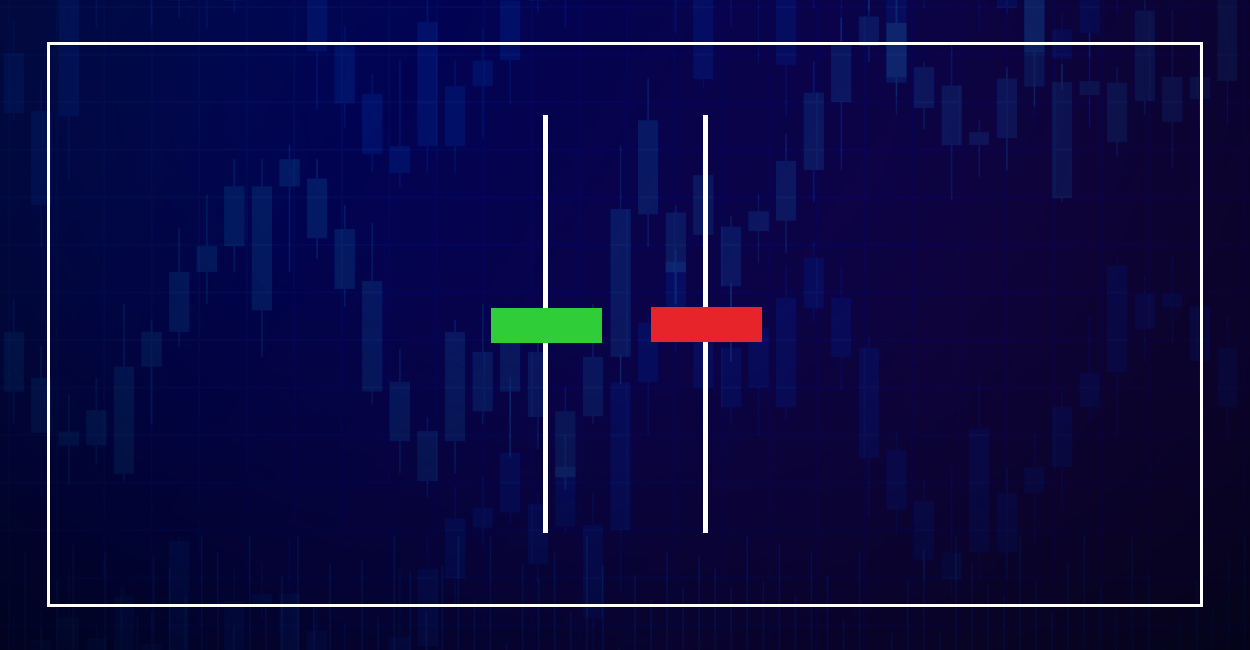
Tweezer
Tweezer is a two bar reversal pattern that is used to catch the tops or bottoms. The Tweezer Top is defined by a two bars where the highs and lows of both the bars are same but the first bar must be bullish and the second bar a bearish one. The Tweezer Bottom is defined by two candles with the same highs and lows where the first candle is a bearish bar followed by a bullish bar. The same high (or low) suggests supply pressure (or demand) at that level in the short term.
Read More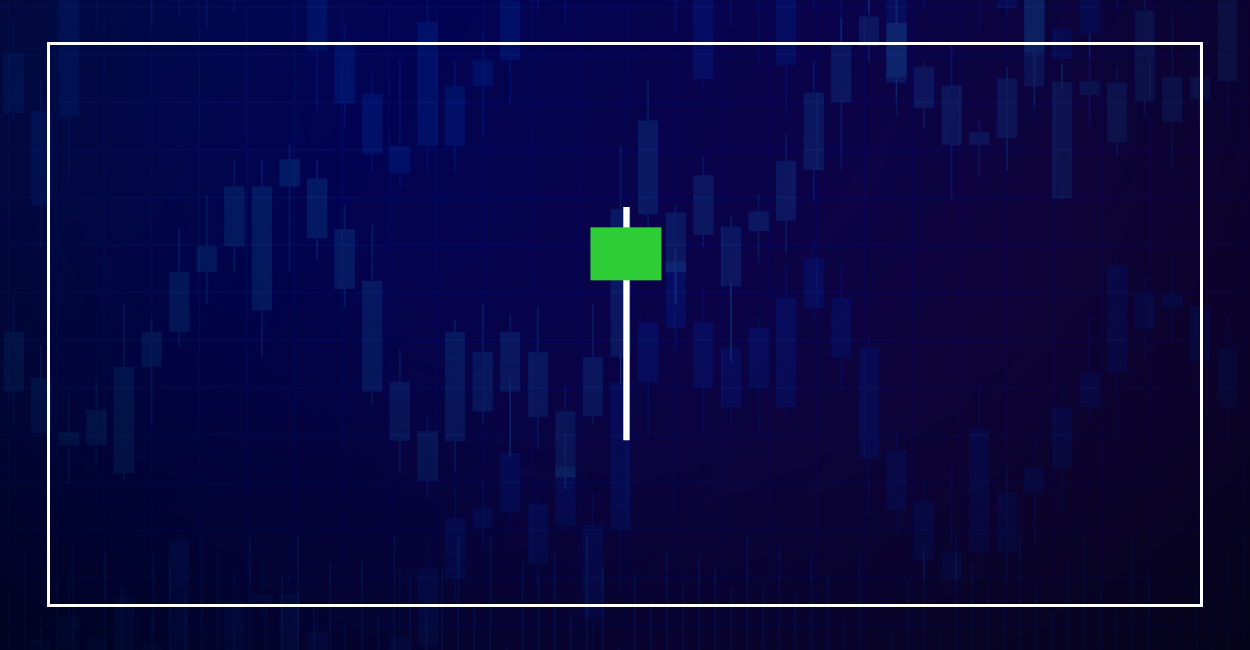
Hammer
The Hammer is a single candle bullish pattern, which comes at the end of a downtrend. The body forms at the very top of the intraday range with a tall lower shadow and no upper shadow (or very small upper shadow). The long lower shadow is supposed to imply buying pressure at the lower levels.
Read More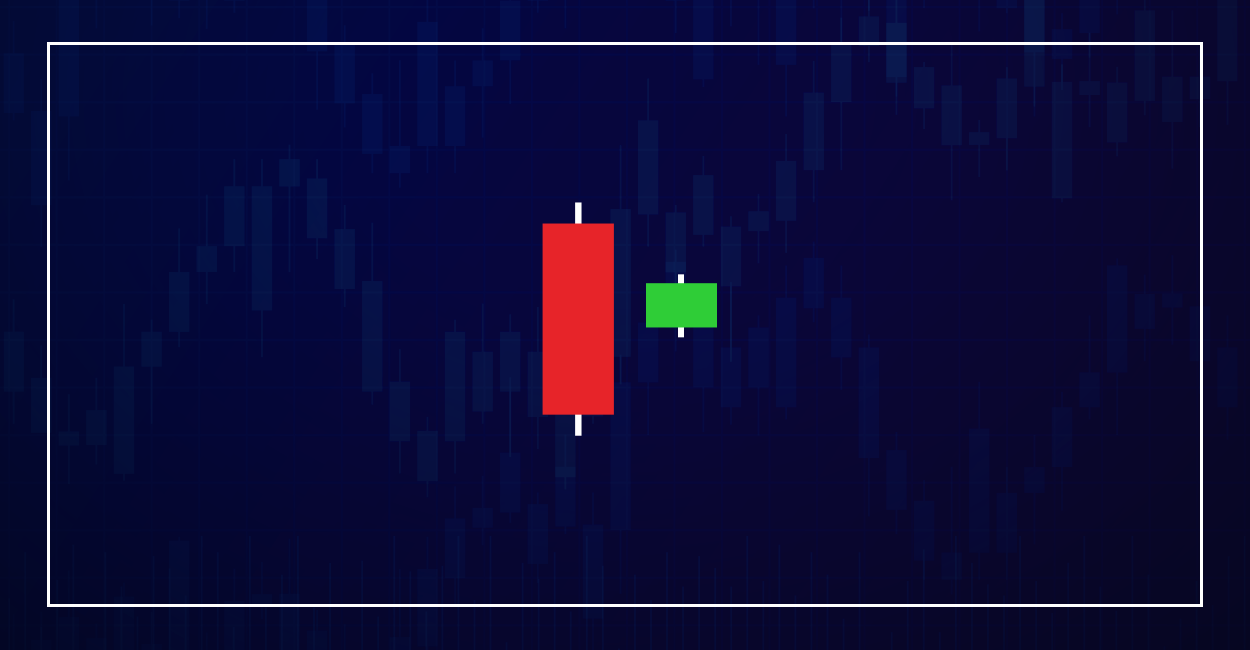
Harami
The Harami pattern is essentially a sign of collapsed volatility and the inability of the trend-rulers to keep their dominance intact. The bullish Harami appears as a small body candle with very small shadows, following a series of large black candles in a downtrend. Similarly, the bearish Harami candle is entirely engulfed by the previous white candle. In both the instances, the sudden contraction of range and the absence of a new low are taken as an exhaustion of the prevailing trend. The pattern is found very frequently but can’t be taken as a very reliable pattern.
Read More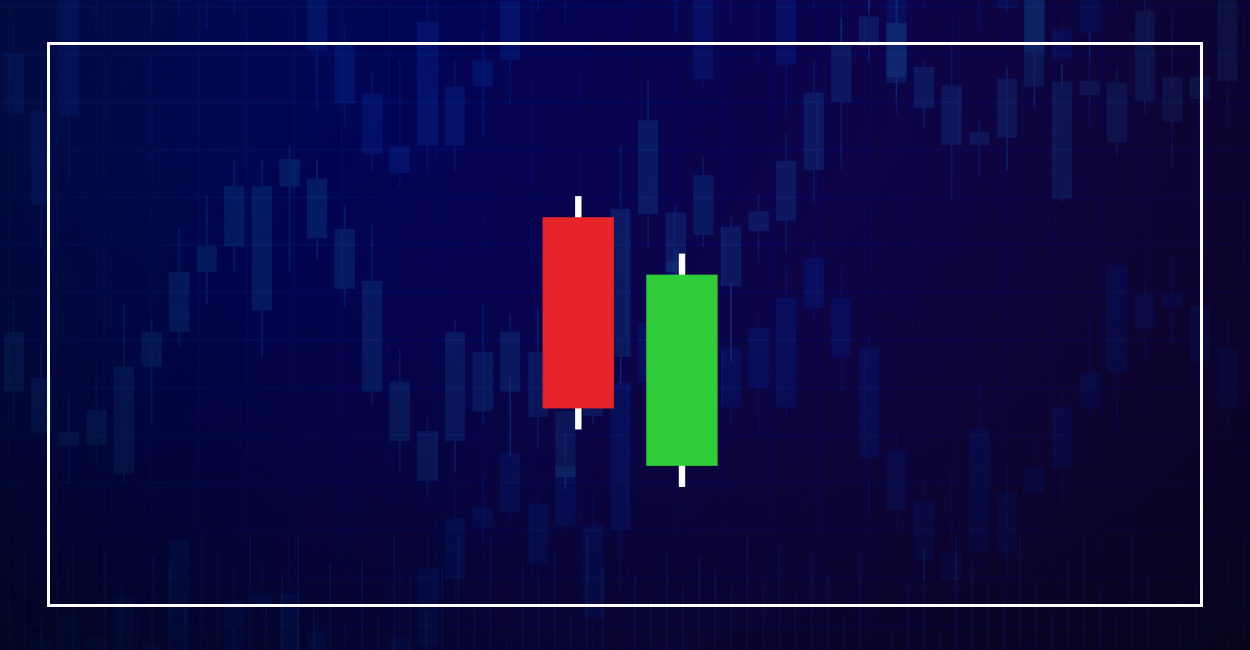
Piercing
The Piercing line is a two candle reversal pattern, which is one of the best performing ones. Generally Piercing Line denotes a bullish reversal pattern as the bearish version is called as the Dark Cloud Cover. The first candle of the pattern follows the prevailing trend strongly, followed by a counter trend candle. In the bullish version, the first candle is a strong black candle, followed by a strong white candle that opens with a gap down but closes above the mid-line of the previous candle. The filling of the gap and the recovery of most of the loss signifies strong bullish sentiment.
Read More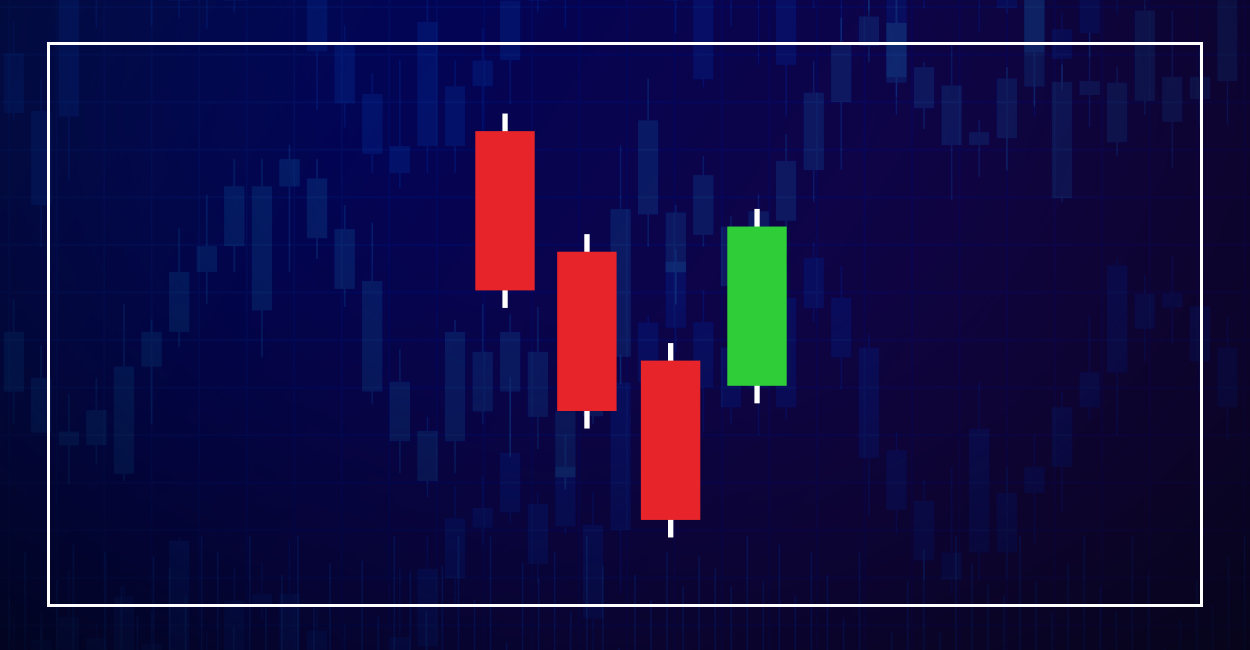
Kicker
Kicker is a two candle reversal pattern that is considered by many among the best signals. It indicates a dramatic change in trend and an equally dramatic change in sentiment. In the bullish version of the pattern, the first candle would be a strong bearish one with the open at the high and close at the low. The second candle would be a bullish candle with the open & low being the same and the closing taking place at the day high. The entire range of the second candle would be higher than the first candle. The bearish version would show the exact opposite order.
Read More
Doji
The Doji is a single candle candlestick pattern that signifies indecision among the market participants or equilibrium among the bulls and the bears. This neutral pattern is characterized by a small range for the day and the closing price getting almost equal with the opening price. There are a lot of variations of this pattern. The Long-legged Doji is very tall in size with the open-close taking place around the middle point of the day, implying huge indecision and a probable large move coming. There are also Graveyard Doji, Dragonfly Doji and Northern Doji, Southern Doji followed by a bunch of 2 or 3 candle patterns involving Doji.
Read More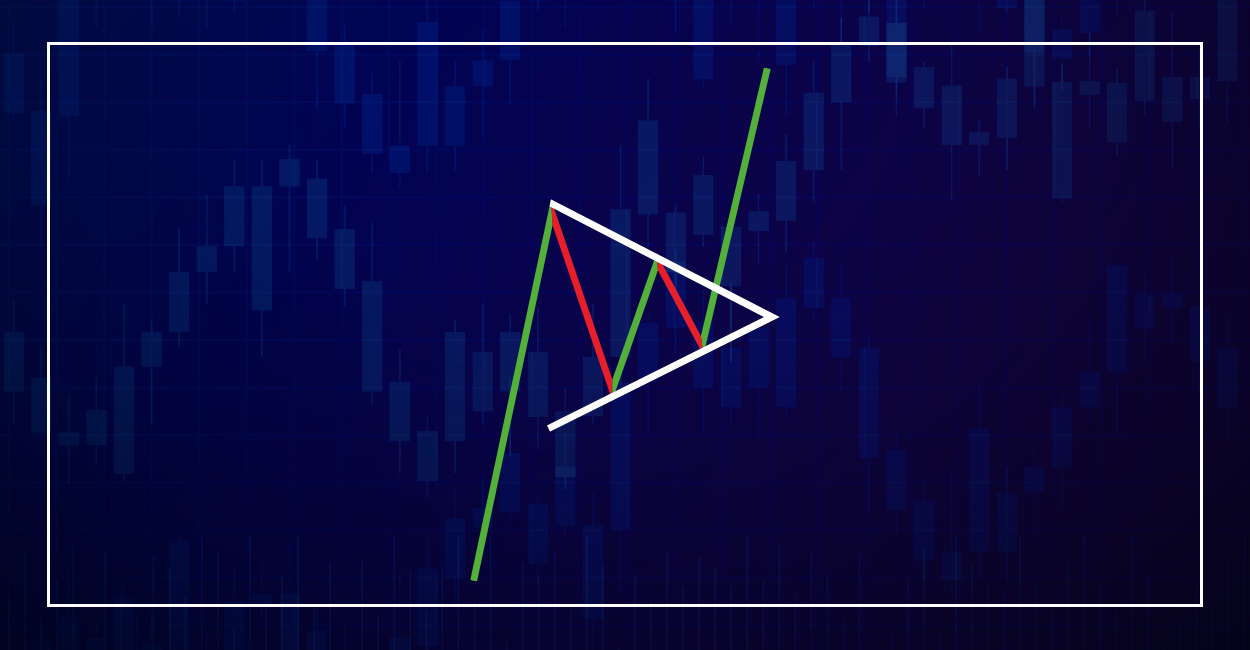
Pennats
The pennant pattern form in the middle of the complete price move, consolidating the prior move. The price change within a small symmetrical triangle that begins wide and converges to a point as the pattern forms. They appear in any market and traders use them to predict movements of proce in the future.
Read More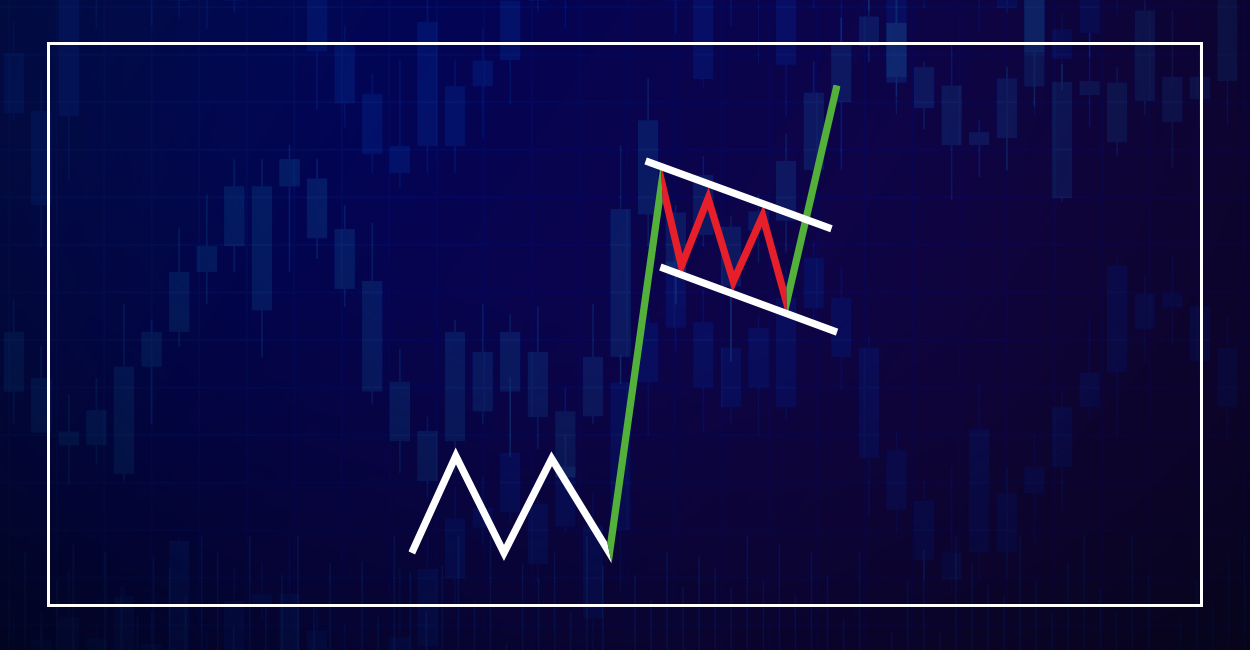
Flags
The flag pattern is a continuation chart formation that can see during a temporary pause in either a bullish or bearish direction. These patterns have two parallel lines that work as support and resistance point during a price consolidation phase which looks the flag with the previous upward move represent the flagpole part. The flag pattern is used to identify the possible extension of a previous price action from a point at which price has move against that same trend. The price advance could be fast, making the timing of a trade advantageous by noticing the flag pattern.
Read More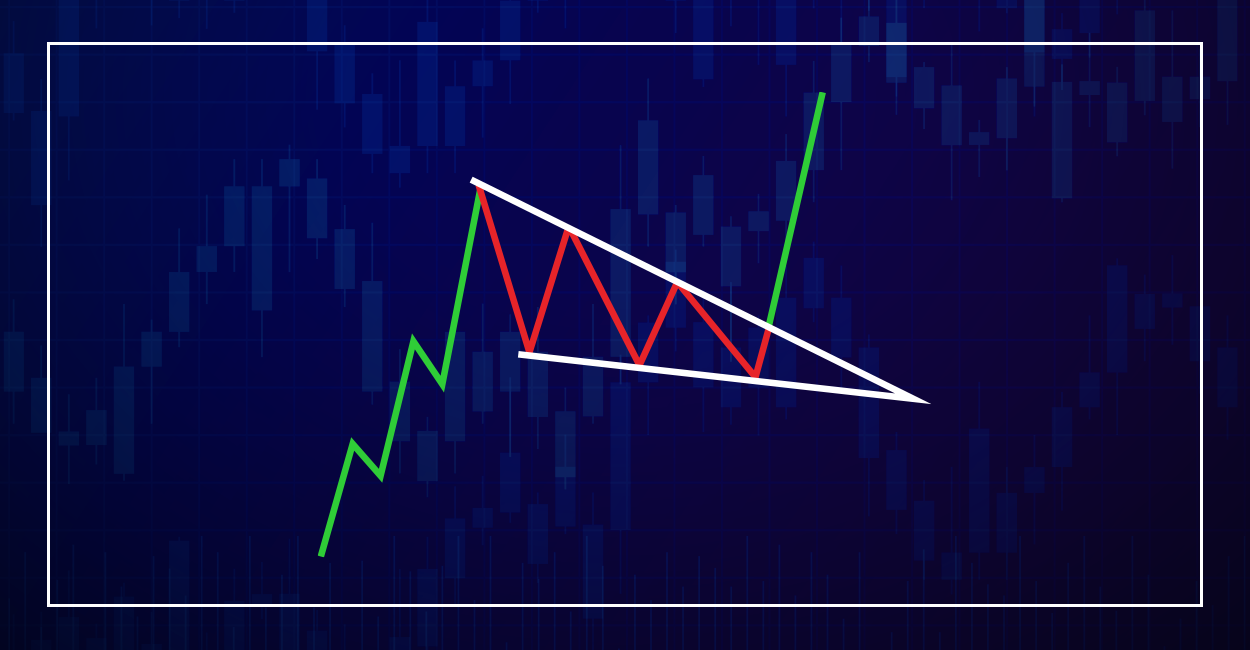
Wedge
The Wedge formation is pattern that looks a lot like the Contracting Triangle but unlike the triangle, the Wedge has a definite slope and a definite bias. The Rising Wedge slopes upward, wide at the bottom and keeps contracting as long as it goes up and the entire pattern is expected to be retraced once the lower line connecting the swing lows are connected. Other theories like Elliott Wave dictates 5 distinct legs must be visible before the pattern can be completed. That means 3 touch points on the upper boundary and 2 on the lower boundary. Exactly the opposite is applicable in case of the Falling Wedge.
Read More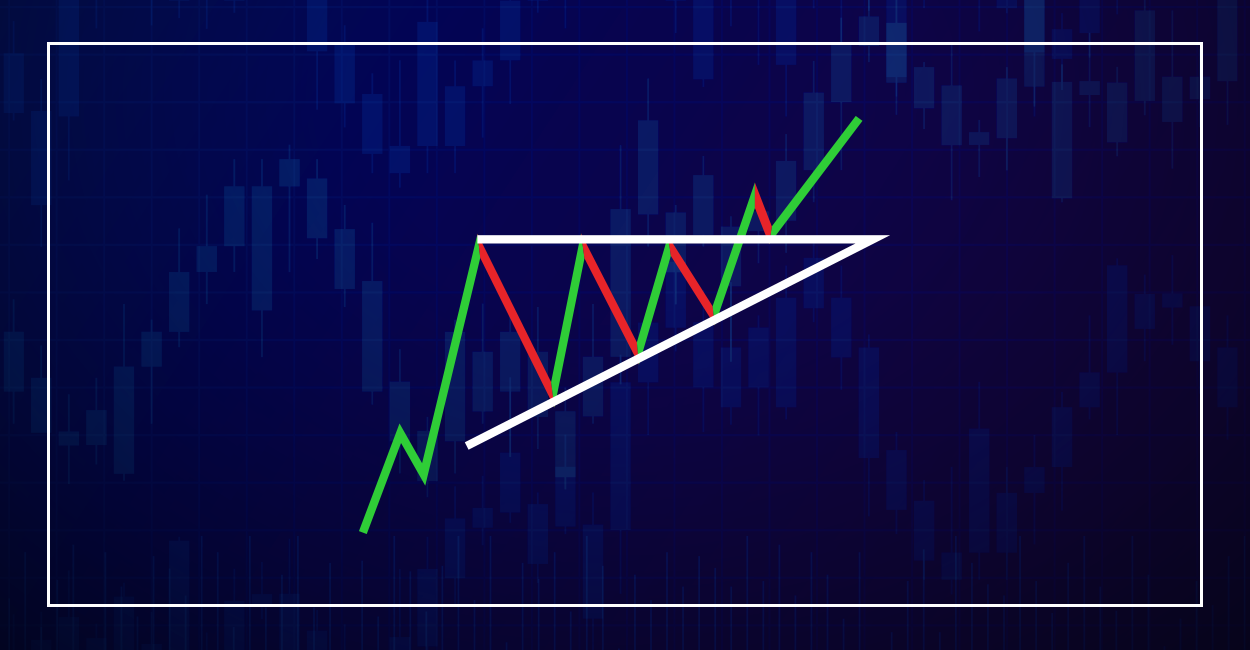
Triangle
The Triangle is a pattern that is created by a series of lower highs and higher lows. When the swing highs and lows are connected, the contraction in price is evident and that’s why it is also called Coil. Generally the volume pattern gives a hint if the pattern is acting as a Continuation pattern or a Reversal pattern. In 80% of the cases at least, it will act as a continuation pattern with the volume showing a downtrend inside the pattern. In an uptrend, Triangles are seen with the highs coming at the same level which are called Ascending Triangles. The Descending Triangle, seen in a downtrend, possesses lows at the same level.
Read More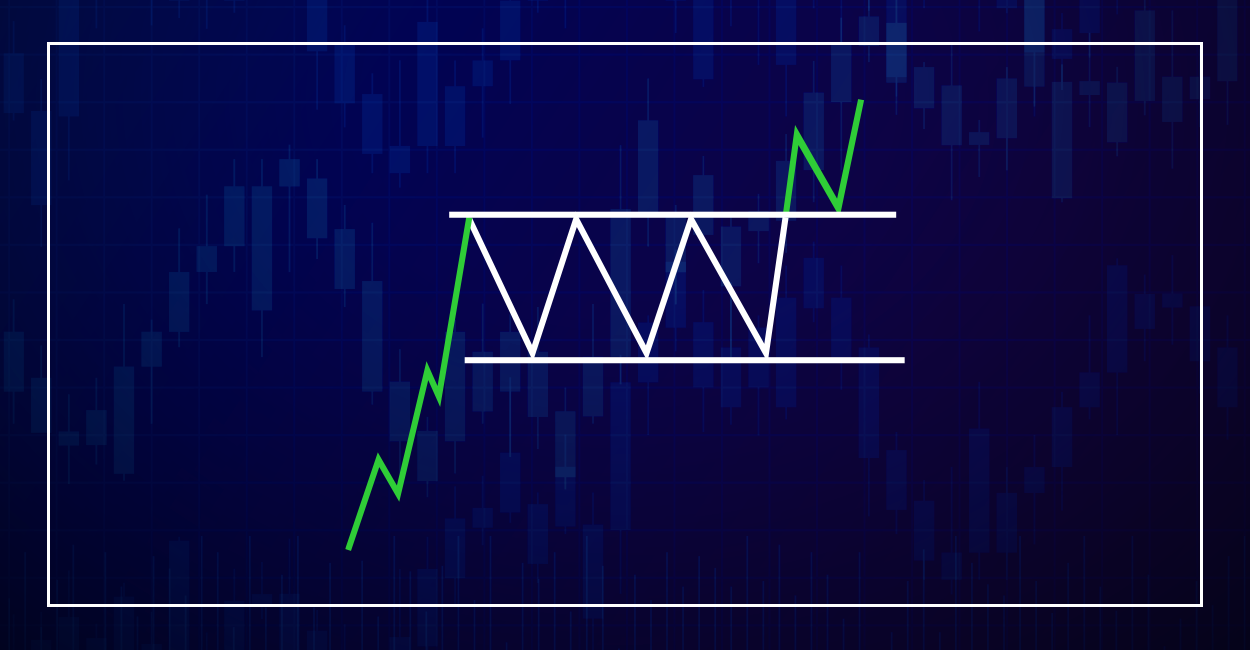
Rectangle
A Rectangle pattern is generally formed when the trend decides to take a pause and the market participants take a break from the market. The pattern is characterized by a confluence of the swing highs taking place almost at the same level, just like the swing lows too. On the Candlestick or Bar charts, the height of the rectangular range is projected from the breakout level to determine the expected target but on a Point & Figures chart, the width of the rectangle is a major factor too. The volume pattern in a Rectangle doesn’t show any marked characteristic.
Read More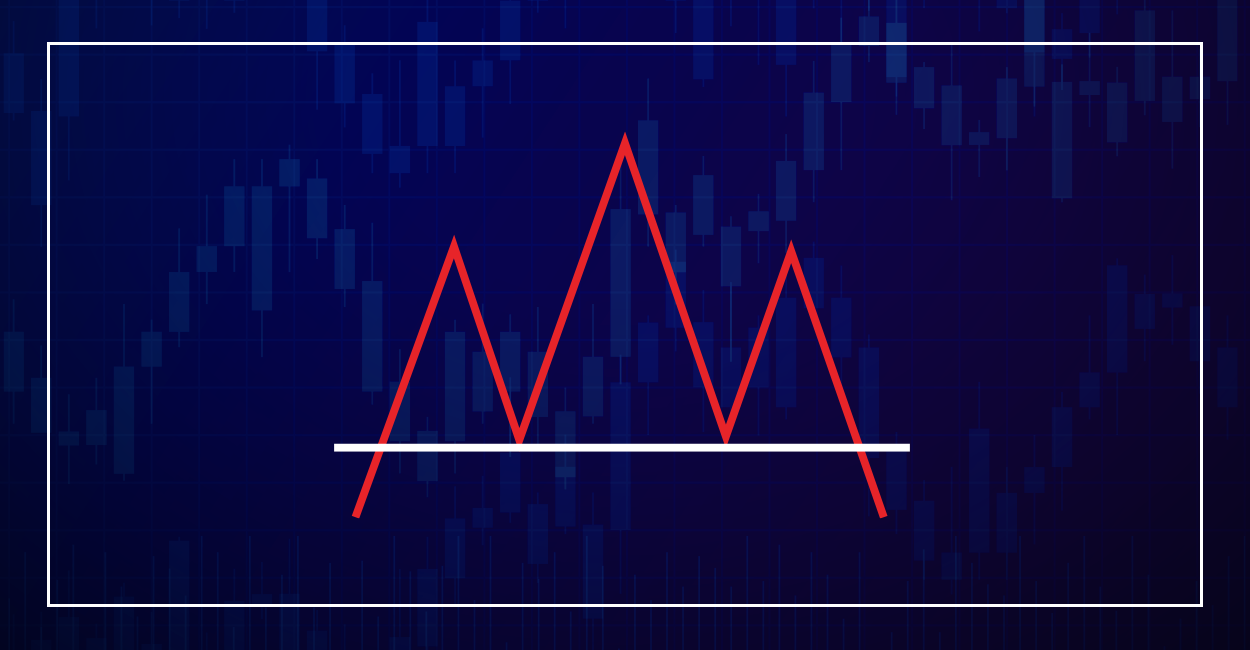
Head & Shoulders
This pattern consists of three peaks with the middle one being the tallest with two smaller peaks on each side. In case of a top, the left peak or shoulder is the first swing high. After a brief correction, a higher high is established with less volume, followed by another weak swing high with very low volume. When the trendline connecting the two swing lows are broken on the downside, the pattern is triggered. The bullish version is called a Head & Shoulders bottom. Sometimes, there are more than two shoulders visible, creating the pattern is called Complex Head & Shoulders.
Read More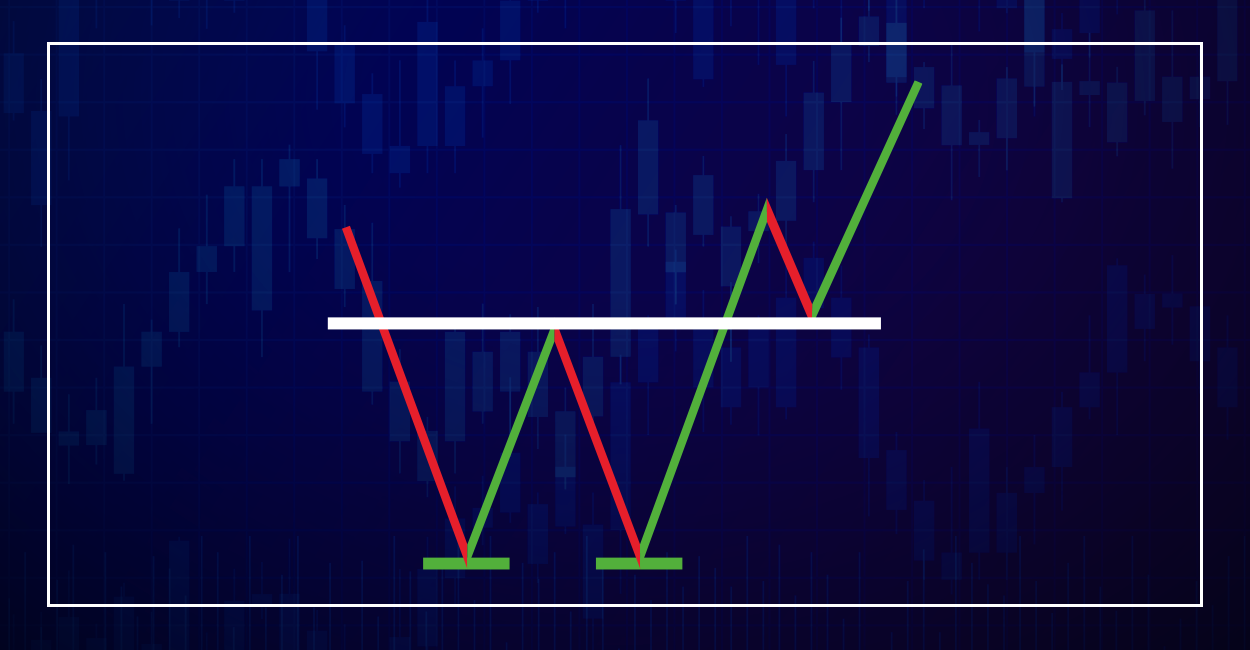
Double Top and Bottom
The Double Top is a bearish pattern that consists of two consecutive peaks with a reasonable valley between those. The peaks take place almost at the same level, depicting the area where supply is getting larger than the demand. The pattern triggers when the lowest level of the pattern, the low of the valley is broken on the downside. Depending on the width of the peaks, the many variations of this pattern are called Adam & Eve Double Top, Adam & Adam Double Top, Eve & Eve Double Top etc. The inverted version of this pattern that appears at the end of a bear market is called a Double Bottom.
Read More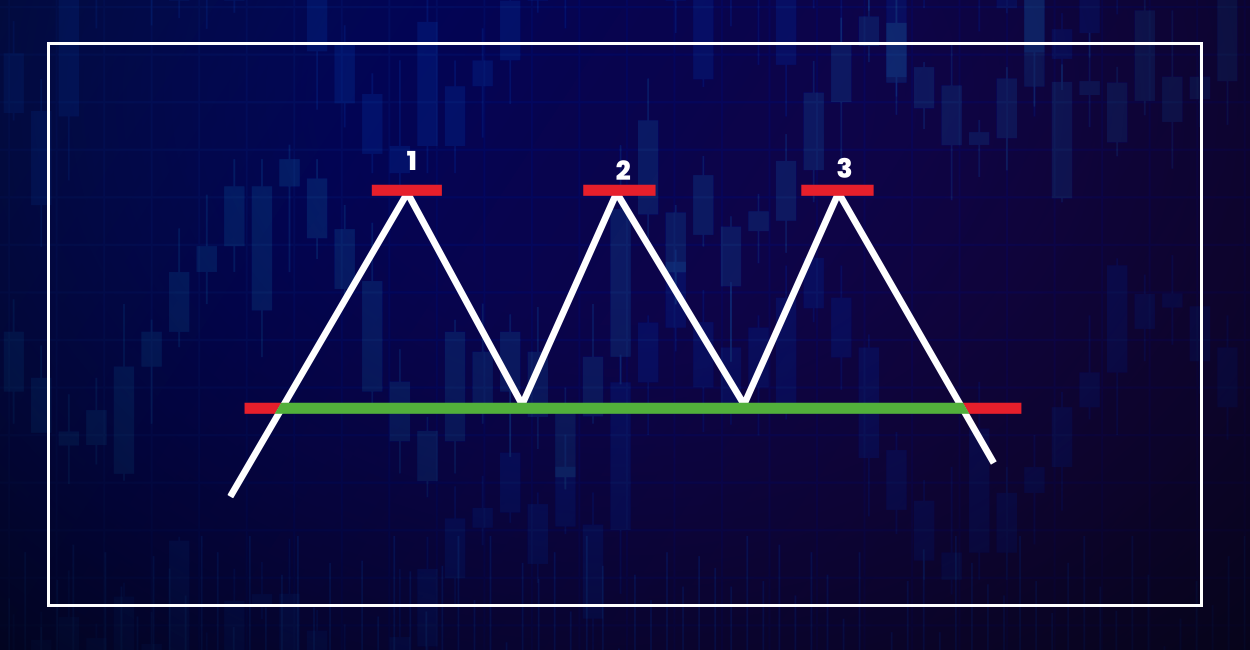
Triple Top and Bottom
The Triple Top is a reversal pattern that is characterized by three equal highs coming around the same price level, followed by a breakdown of the support level. The bullish version of this pattern is called the Triple Bottom. The Triple Top is not as frequently seen as the Double Top and the 3 tops may not be exactly equal. The two swing lows may not come at the same level too. The pattern is triggered when the lowest swing low of the pattern is broken on the downside, after the third top is registered. Triple Bottom follows exactly the opposite rule.
Read More